


Even though the broader stock market showed signs of pulling back, so far, signs don’t show that it’s time to panic. The S&P 500 ($SPX) was up 10.6%, the Dow Jones Industrial Average ($INDU) was up 5.6%, and the tech-heavy Nasdaq was up over 9% in Q1 2024. All three indexes hit new highs in Q1. With an extended stock market, you can’t rule out the possibility of a correction.
A Macro Look At the Stock Market
The US economy keeps growing, the labor market is strong, and inflation is higher than the Fed’s 2% target. The narrative is that the Fed may have fewer interest rate cuts in 2024 than the three suggested at the last meeting. Yet, investors continue to invest in US stocks.
Commodity prices have been moving higher. Oil prices have broken out of their downtrend and are moving higher. Gold prices have hit all-time highs, silver prices have hit a 52-week high, and cocoa futures have skyrocketed (the chart below was created using the StockChartsACP Layouts tool). Be prepared to pay more for those chocolate bars and your daily espressos (coffee futures are up too).

CHART 1. A LOOK AT OIL, GOLD, SILVER, AND COCOA PRICES. All four commodities have seen their prices rise in a cooling inflationary environment. Does the commodity market know something we don’t? Chart source: StockChartsACP. For educational purposes.
Pull up a chart of the Invesco DB Commodity Index (DBC) to view the overall performance of commodities. The chart below shows that DBC has bottomed and is reversing. Yet, it’s getting close to a resistance level, which means the commodity rally could be short-term.

CHART 2. DAILY CHART OF INVESCO DB COMMODITY INDEX (DBC). In the last 18 months, DBC appears to have bottomed and starting to reverse. It remains to be seen how high DBC can go. It’s approaching a near-term resistance level, and a break above it could be a cue to be more aware and vigilant. Chart source: StockCharts.com. For educational purposes.
Why should investors look at commodity charts? If commodity prices continue to rise when inflation hovers around 3%, it could be a cause for concern. But that may not happen for a while. As long as investors keep investing and buying pressure exceeds selling pressure, the stock market will continue increasing.
Look at how stocks like NVIDIA (NVDA), Microsoft (MSFT), and Alphabet (GOOGL) have been performing? They’re all trading well above their 50-day simple moving average (SMA). When the leaders pull back, it’s not time to panic, especially if market breadth is still positive—more advances vs. declines, percentage of stocks trading above their 50-day SMA is greater than 50, and the Bullish Percent Index is above 50—things are still going well.
 CHART 3. THE STOCK MARKET BREADTH. The daily chart of the S&P 500 displays several market breadth indicators in the lower panels. Advances are higher than declines, the percentage of S&P 500 stocks trading above their 50-day moving average is close to 80%, and the S&P 500 Bullish Percent Index shows bullish stock market activity. Chart source: StockCharts.com. For educational purposes.
Watch the S&P 500 Sectors
Another confirming signal is to look at sector performance. The three-month Sector Summary below shows that Communication Services, Energy, and Technology were the top three performers in the last three months. Energy crept up to the top, which suggests some rotation is taking place. However, if Communication Services, Technology, Industrials, and Financials remain strong, the bull market will still be in play.

CHART 4. SECTOR SUMMARY FOR THE LAST THREE MONTHS. Communication Services, Energy, and Technology are the top three sector performers, but Industrials and Financials are not far behind. This supports a continuing bull market. Chart source: StockCharts.com. For educational purposes.
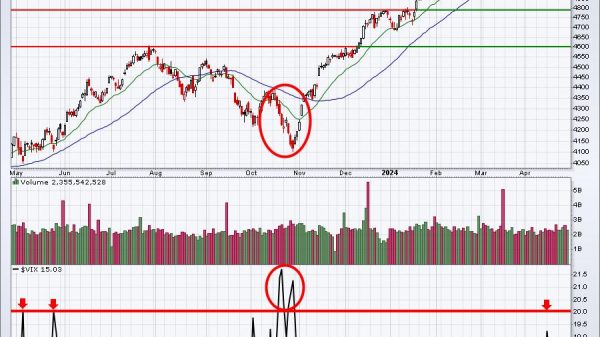
The Cboe Volatility Index ($VIX) hit a high of 15.43 on Tuesday, stirring up some investor concerns. But it’s still relatively low and has now come off that high. If the VIX moves into the 16 or 17 territory and stays there, then it may be time to keep a closer watch on the VIX.
The Bottom Line
If the US economy continues growing, corporate earnings are positive, and AI stocks are in the spotlight, the stock market could continue moving higher, regardless of whether the Fed cuts rates. But be alert for any changes. Watch the bond markets, commodity prices, and volatility.
The Market Overview panel on the StockCharts platform gives a great bird’s eye view of the stock market. Click on the different tabs—Equities, Bonds, Commodities, Crypto—to get a sense of the overall market. The Sector Summary is another tool all traders and investors should closely monitor.


Disclaimer: This blog is for educational purposes only and should not be construed as financial advice. The ideas and strategies should never be used without first assessing your own personal and financial situation, or without consulting a financial professional.