


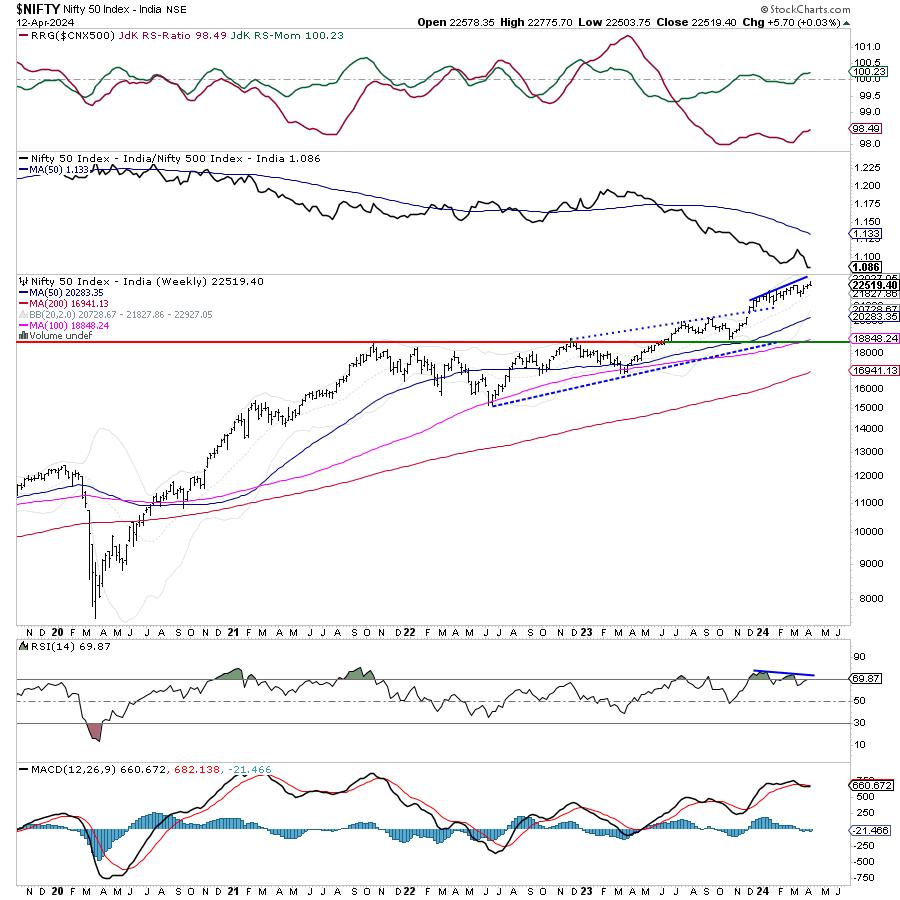
Over the previous week, the markets were expected to inch higher; however, at the same time, while it was expected that incremental highs may be formed, it was also expected that a runaway move would not happen. Over the past four trading sessions, the markets traded precisely on these analyzed lines. The Nifty formed a fresh lifetime high of 22775, but at the same time, it came off from those highs as well. The trading range also got narrower as the Nifty oscillated in a 271-point range. Volatility increased slightly; India Vix rose marginally by 1.72% to 11.53. The headline Index Nifty closed flat with a negligible weekly gain of 5.70 points (-0.03%).

The previous week was truncated as Thursday was a trading holiday on account of Eid-ul-Fitr. The coming week is also truncated, with Wednesday being a holiday on account of Ram Navmi. Due to this Banknifty Options has its shortest expiry as they would expire as early as Tuesday. The level of 22775 creates a new intermediate top for the markets; over the coming days, no runaway upmove is expected so long as the Nifty stays below this point. At the same time, the nearest support for the index exists much below the current levels at 20-week MA which is placed at 21827. By and large, the markets are likely to stay in a broad trading range.
The markets may see a soft start to the week on Monday. The levels of 22650 and 22775 are likely to act as potential resistance points. The supports come in at 22400 and 22280 levels.
The weekly RSI is at 69.87; it has crossed under 70 from the overbought zone. When subjected to pattern analysis, RSI continues to show negative divergence against the price. It has also formed a new 14-period low which is bearish. The weekly MACD is bearish and stays below its signal line.
The pattern analysis shows that the Index has continued resisting the upward-rising trendline on the weekly charts. The upward-rising nature of the trendline is allowing the Nifty to form incremental highs; however, it is also providing strong resistance to the index as it tries to move higher. As of now, the Index has been resisting this pattern resistance every week, and this time it faced selling pressure as well. A bearish divergence on the RSI continues to exist; the nearest support for the Index may be found at the 20-week MA which is placed at 21827
All in all, the risk-off setup might continue to persist for some time. Technical rebounds in the markets may be seen; however, it is strongly recommended that such rebounds be utilized to make exits and protect profits at higher levels. All fresh purchases may be kept limited to defensive pockets, and more emphasis must be placed on getting into stocks with stronger relative strength as such stocks tend to offer resilience during corrective times. Overall, while keeping leveraged exposures at modest levels, a cautious outlook is advised for the coming week.
Sector Analysis for the coming week
In our look at Relative Rotation Graphs®, we compared various sectors against CNX500 (NIFTY 500 Index), which represents over 95% of the free float market cap of all the stocks listed.
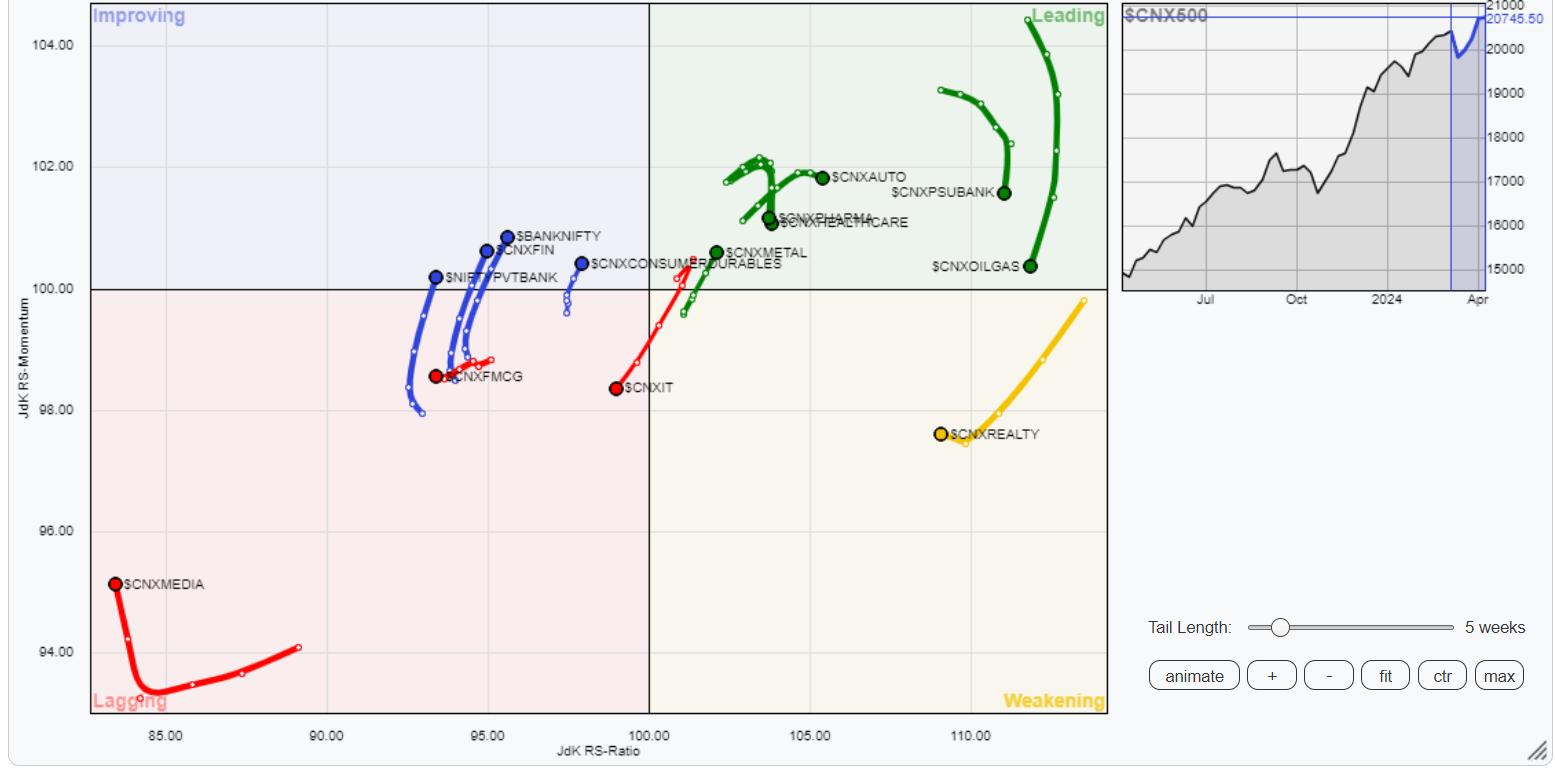
Relative Rotation Graphs (RRG) show a loss of relative momentum among many sectors that are placed inside the leading quadrant. The Nifty PSU Banks, Pharma, and Commodities are inside the leading quadrant. However, they are seen giving up on their relative momentum against the broader markets. The Metal Index and Auto Index seem relatively better placed inside the leading quadrant.
The Nifty Energy and Infrastructure indices have rolled inside the weakening quadrant. They are likely to start slowing down on their relative outperformance. Besides these groups, the PSE and the Realty indices are also inside the weakening quadrant.
The Nifty IT, Media, and FMCG indices stay inside the weakening quadrant.
The Nifty Financial Services, Services Sector Index, Banknifty, and Consumption Index stay inside the improving quadrant and may offer resilient performance relative to the broader markets.
Important Note: RRG™ charts show the relative strength and momentum of a group of stocks. In the above Chart, they show relative performance against NIFTY500 Index (Broader Markets) and should not be used directly as buy or sell signals.
Milan Vaishnav, CMT, MSTA
Consulting Technical Analyst
www.EquityResearch.asia | www.ChartWizard.ae