


In July 2024, the American Institute for Economic Research’s Everyday Price Index (EPI) rose 0.30 percent to 291.3. With this increase the EPI resumes an upward trend that was broken with a slight decline in June 2024. Since January 2023, our proprietary index has risen fourteen out of the last nineteen months.
AIER Everyday Price Index vs. US Consumer Price Index (NSA, 1987 = 100)
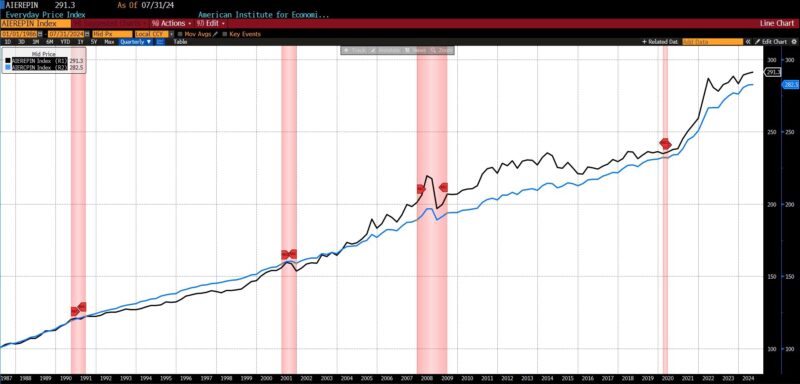
Among the twenty-four EPI constituents in July 2024, twenty-one rose in price, two were unchanged, and one declined. The sole decline in prices occurred in pet and pet products; rising the most in price were the motor fuel, food at home, and food away from home categories.
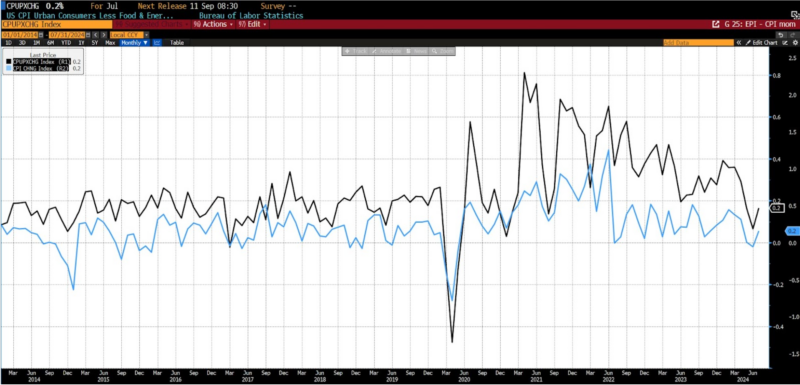
On August 14, 2024, the US Bureau of Labor Statistics (BLS) released Consumer Price Index (CPI) data for July 2024. The month-to-month headline CPI number rose by 0.2 percent, meeting forecasts. The core month-to-month CPI number also increased by 0.2 percent, which also agreed with survey predictions of 0.2 percent.
In July, the food index rose by 0.2 percent, consistent with the increase observed in June. Within this category, the food at home index inched up by 0.1 percent. Of the six major grocery store food group indexes, three experienced gains while the other three saw declines. Specifically, the index for meats, poultry, fish, and eggs jumped 0.7 percent, driven by a significant 5.5 percent increase in the eggs index. The indexes for fruits and vegetables and nonalcoholic beverages also recorded gains, rising by 0.8 percent and 0.5 percent, respectively.
Conversely, the index for other food at home dropped by 0.5 percent in July, after a 0.5 percent increase in June. Similarly, the cereals and bakery products index decreased by 0.5 percent, while the dairy and related products index edged down by 0.2 percent. The food away from home index also saw a 0.2 percent rise in July, following two months of stronger 0.4 percent increases. Breaking this down further, the index for limited-service meals rose by 0.3 percent, and the index for full-service meals increased by 0.1 percent.
In the energy sector, the index remained unchanged in July, following a 2.0 percent decline in June. The gasoline index also showed no change over the month, although unadjusted gasoline prices rose by 0.8 percent. The electricity index saw a modest increase of 0.1 percent, while the fuel oil index climbed by 0.9 percent. In contrast, the natural gas index fell by 0.7 percent.
Excluding food and energy, the all-items index rose by 0.2 percent in July, slightly up from the 0.1 percent increase in June. Within this, the shelter index grew by 0.4 percent, with rent climbing 0.5 percent and owners’ equivalent rent up by 0.4 percent. The lodging away from home index reversed its 2.0 percent decline in June, rising by 0.2 percent in July.
The medical care index decreased by 0.2 percent in July, after a 0.2 percent rise in June. Within this sector, the index for hospital services dropped 1.1 percent, though the indexes for physicians’ services and prescription drugs both edged up by 0.1 percent. The motor vehicle insurance index saw a significant increase of 1.2 percent in July, following a 0.9 percent rise in June. The index for household furnishings and operations grew by 0.3 percent over the month, with additional increases observed in the indexes for education, recreation, and personal care.
On the other hand, the index for used cars and trucks continued its downward trend, falling by 2.3 percent in July after a 1.5 percent decrease in June. The airline fares index also dropped by 1.6 percent, while the apparel index declined by 0.4 percent, and the new vehicles index slipped by 0.2 percent.
July 2024 US CPI headline & core month-over-month (2014 – present)
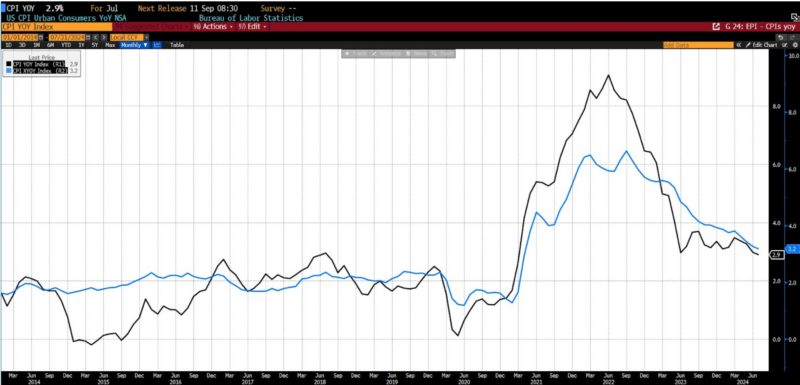
In year-over-year data, headline CPI rose 2.9 percent, less than the expected 3.0 percent rise. Year-over-year core CPI rose 3.2 percent, meeting the 3.2 percent prediction.
July 2024 US CPI headline & core year-over-year (2014 – present)
Over the past 12 months, the index for food at home increased by 1.1 percent. Among the categories, the meats, poultry, fish, and eggs index saw a notable rise of 3.0 percent, while nonalcoholic beverages index grew by 1.9 percent. The index for other food at home experienced a more modest increase of 0.9 percent. The index for cereals and bakery products, however, remained unchanged during this period. In contrast, the indexes for both fruits and vegetables and dairy and related products each declined by 0.2 percent over the last year.
The index for food away from home saw a more significant rise, climbing 4.1 percent over the last 12 months. Breaking this down, the index for limited service meals increased by 4.3 percent, and the index for full service meals rose by 3.8 percent during the same period.
The energy index experienced a 1.1 percent increase over the past year. Within this category, the electricity index surged by 4.9 percent as the natural gas index went up by 1.5 percent. The gasoline index decreased by 2.2 percent, and the fuel oil index saw a slight decline of 0.3 percent over the 12-month span.
Excluding food and energy, the year-over-year index rose by 3.2 percent. The shelter index was a major driver, increasing by 5.1 percent and accounting for more than 70 percent of the total 12-month rise in the all items less food and energy index. Other indexes that recorded significant increases over the year include motor vehicle insurance, which surged by 18.6 percent; medical care, up 3.2 percent; personal care up 3.4 percent; and recreation up 1.4 percent.
The positive progress on disinflation over the past three months suggests that the Fed’s goals of price stability and full employment are not at odds, but challenges may surface by the end of 2024. The labor market is expected to cool significantly as the year progresses, and there remains a possibility that certain non-cyclical factors will see the rate of inflation stabilize at a level above the Fed’s 2-percent target later this year or early in 2025.
The resurgence of the “supercore” inflation measure, which excludes housing from core services, indicates ongoing price pressures that could keep the Fed cautious about cutting interest rates as much as some market participants have hoped (as expressed via market implied policy rate markets). In July 2024, supercore rebounded by 0.21 percent after two consecutive monthly declines, although the annual rate slipped slightly to 4.48 percent from 4.67 percent in June. Most categories saw increases in July other than core goods, which have been instrumental in the recent price cooling. A key takeaway from the latest CPI data is that housing costs continue to drive inflation higher. Some economists had forecast that substantial rent increases would have eased by now, but the numbers suggest that the housing inflation story isn’t over yet.
Despite this, it is quite likely that the Fed will proceed with a rate cut at its September 17 – 18 meeting. Speculation will now likely shift toward the size of that rate cut, yet with several more inflation, unemployment, consumption, and other reports due before the next Fed meeting, such projections currently lack substantive value.