


Not everyone likes to take a contrarian stance. Most people prefer to move with the market, not against it. But for those who thrive on going against the grain, extreme market movements — whether a rally or selloff — present opportunities.
Wednesday morning was one of those sessions. The Consumer Price Index (CPI) report came in hotter than expected, sending markets into an early plunge before trading mixed later in the day. This presented an ideal opportunity to hunt for stocks that might be bottoming.
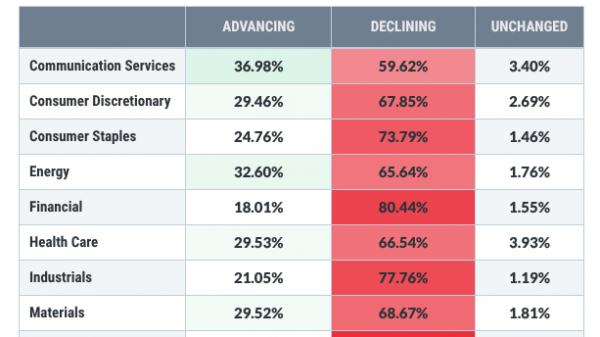
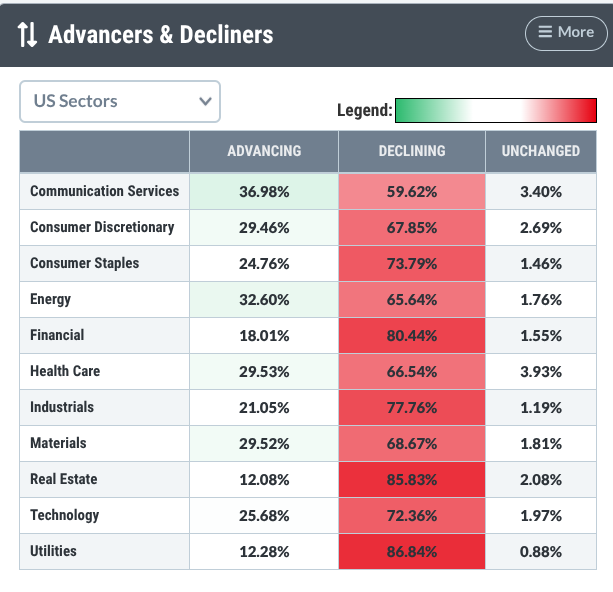
My first move was to check the StockCharts’ Advancers & Decliners tool on my Dashboard for a real-time picture of market activity.

FIGURE 1. ADVANCERS & DECLINERS TOOL SECTORS VIEW. The hardest hit were Real Estate and Utilities.
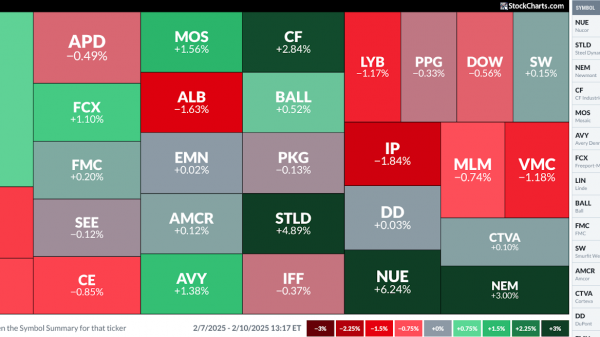
The Real Estate and Utilities sectors were the most affected in the early part of the trading day. I needed a second angle to view the sector action. So, I switched over to the Sector Summary tool.
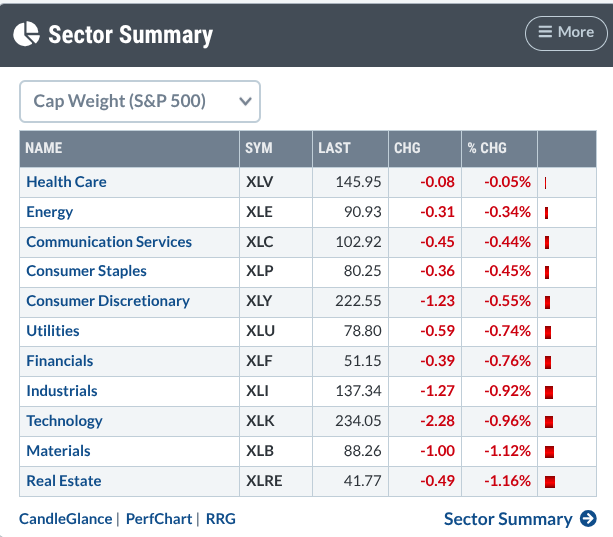
FIGURE 2. SECTOR SUMMARY TOOL. Percentage-wise, real estate had lost the most at the time of viewing.
After deciding to focus on the Real Estate sector, I ran a bearish New 52-Week Lows scan to see what I might find.

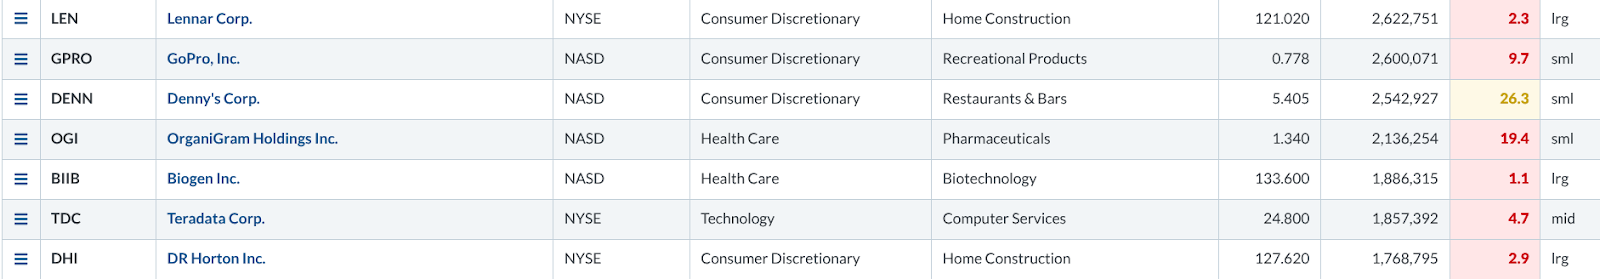
FIGURE 3. IMAGE OF SCAN PAGE AND RESULTS. I found two homebuilder stocks: DHI and LEN.
DR Horton Inc. (DHI) and Lennar Corp. (LEN), two of the biggest US homebuilders, were making new 52-week lows.
Full transparency: If you notice the super-low SCTR scores, well, they’re making new 52-week lows … and I’m searching for a bottom, not only price-wise, but in terms of a turnaround from extreme technical weakness.
But how were they compared to their industry peers? To analyze their relative performance, I switched over the PerfCharts to get a comparative view, adding SPDR S&P Homebuilders ETF (XHB) as an industry proxy in addition to a third major homebuilder—Toll Brothers, Inc. (TOL). TOL wasn’t on the list, but, as one of the major homebuilders showing relative strength despite its decline, I included it for comparison.
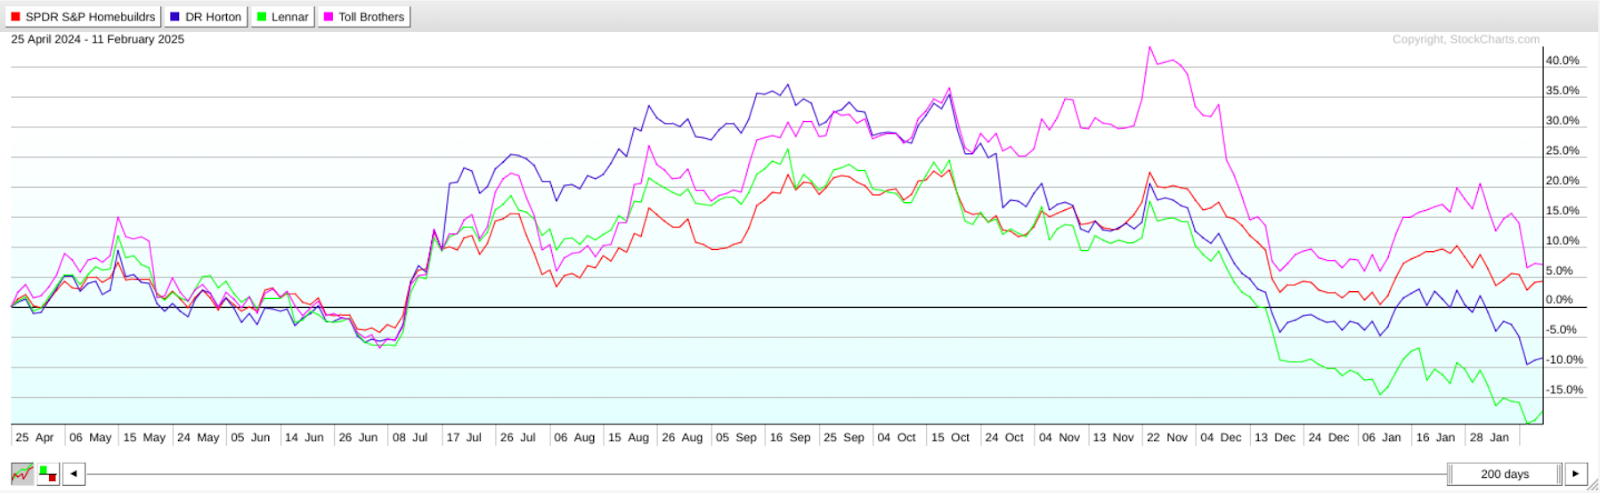
FIGURE 4. PERFCHARTS COMPARING XHB, DHI, LEN, AND TOL. TOL is the only stock outperforming its industry peers.
TOL is the only stock outperforming its peers, with LEN and DHI leading XHB downwards.
Back to my objective, I’m looking for stocks within the industry that might be close to bottoming out. But before I can do that, I must assess whether the industry might be bottoming out and if the current market response to the newly released CPI figures may be overextended or justified by underlying valuations.
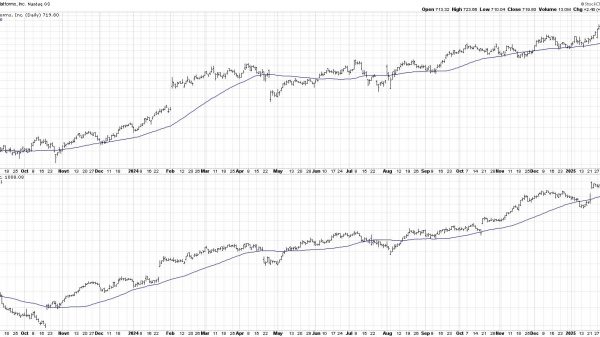
Below is a five-year weekly chart of XHB.
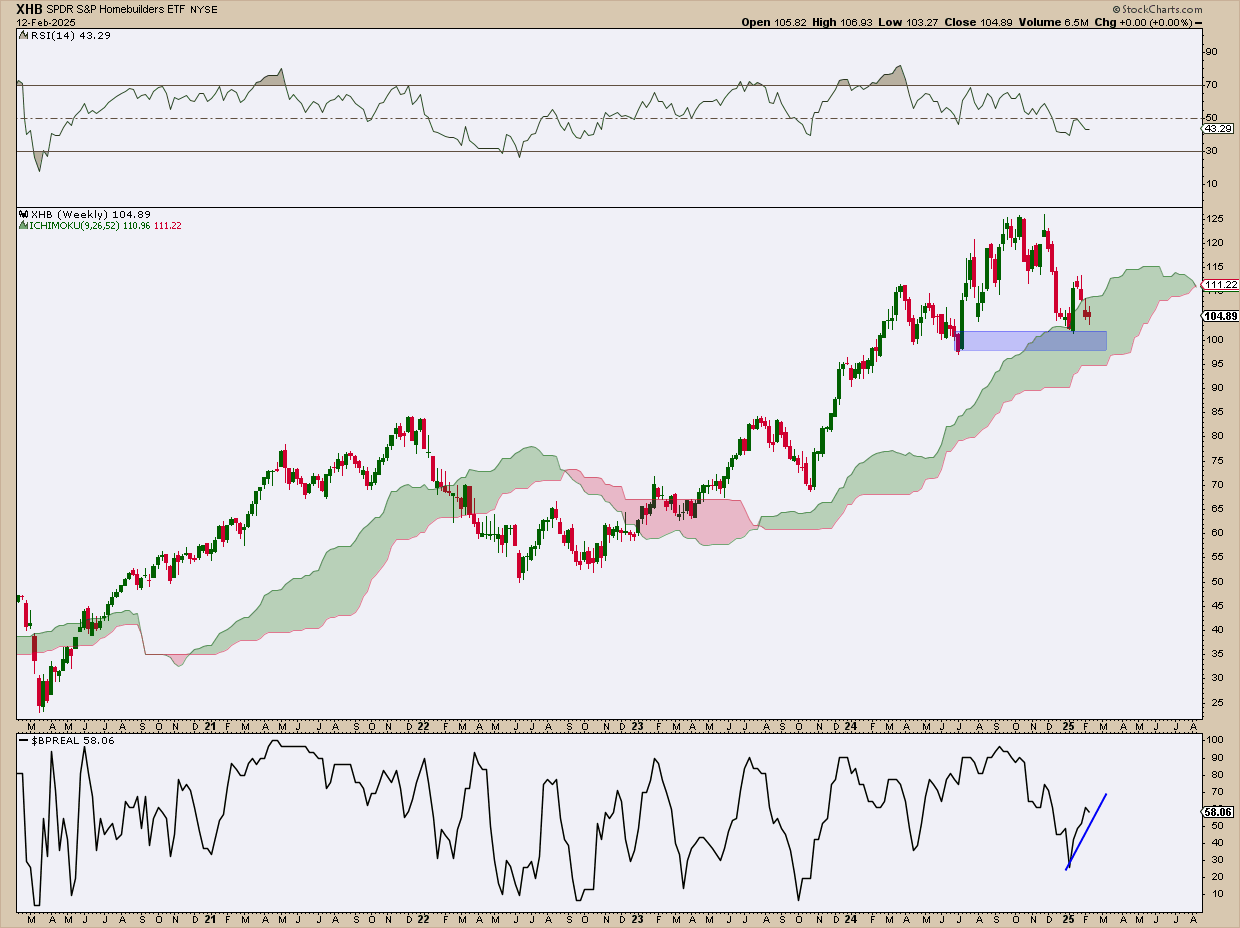
FIGURE 5. WEEKLY CHART OF XHB. The index topped, but will it bounce or continue its decline?
If you look at XHB’s rising prices from the beginning of 2024 through October, in contrast to the Relative Strength Index’s (RSI) decline from above the 70 threshold, the bearish divergence is clear, confirming XHB’s topping action. The RSI is below the 50-line but nowhere near oversold territory.
Looking at sector breadth, the Real Estate Bullish Percent Index (BPI) is currently favoring the bulls, as over 50% of stocks within the sector are triggering Point & Figure “buy” signals. Although homebuilders don’t appear to be participating in this rally, will the broader sector eventually help lift the industry (in other words, are homebuilders bottoming)?
The critical level to watch here is $97 to $101 (see blue highlight), two swing lows that should serve as technical support. To broaden the viable support range, I overlaid an Ichimoku Cloud. If XHB falls below either the swing low or the cloud, then, technically, there’s plenty of downside to go. If it bounces, then a bullish case might take shape.
With this in mind, look at all three stocks (TOL, LEN, and DHI) side by side.
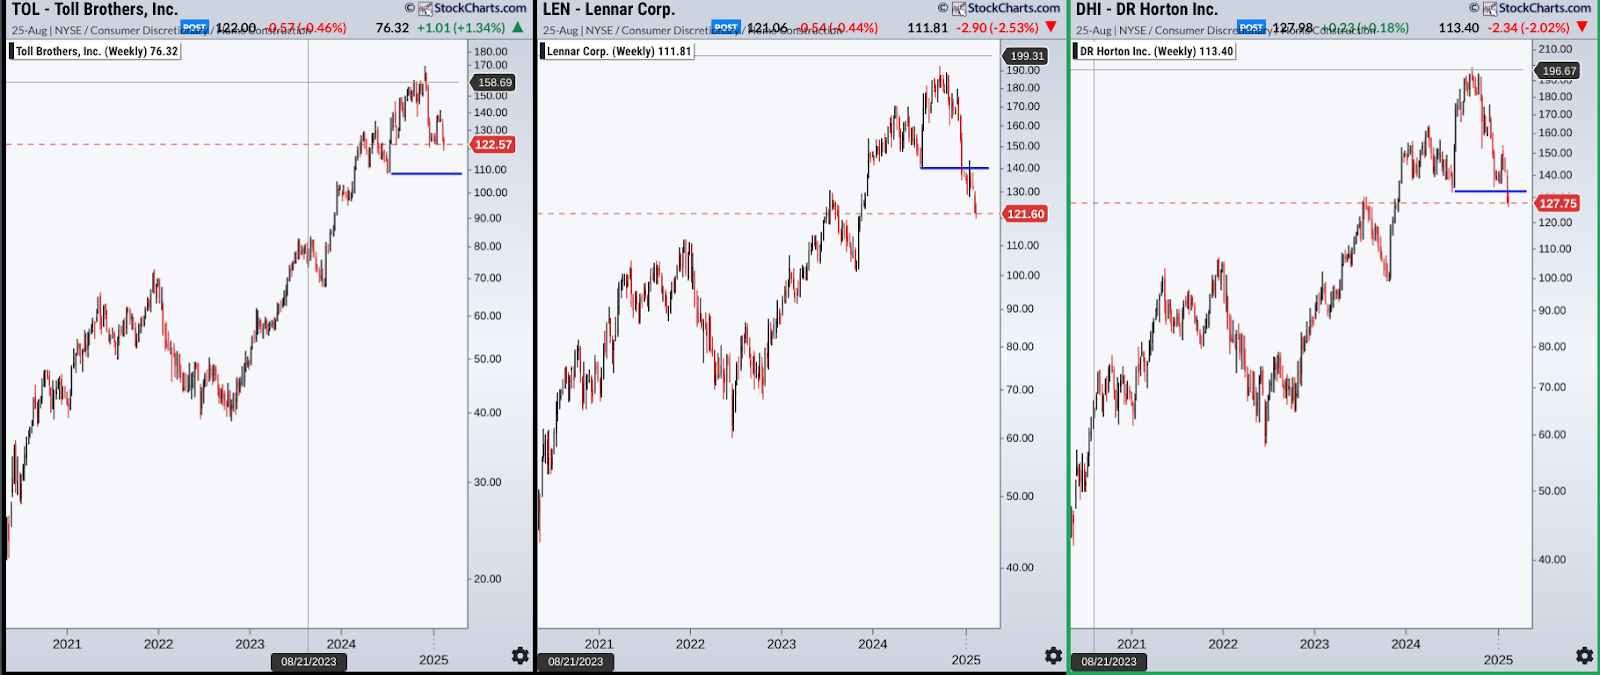
FIGURE 6. ACP CHARTS OF TOL, LEN, AND DHI. TOL, the better-performing stock, is nearing a critical support level.
The blue horizontal lines in each chart mark recent swing lows, all of which are (or were) critical support levels. TOL is about to test that level, while LEN and DHI have already fallen below theirs.
Here’s a daily chart of TOL.
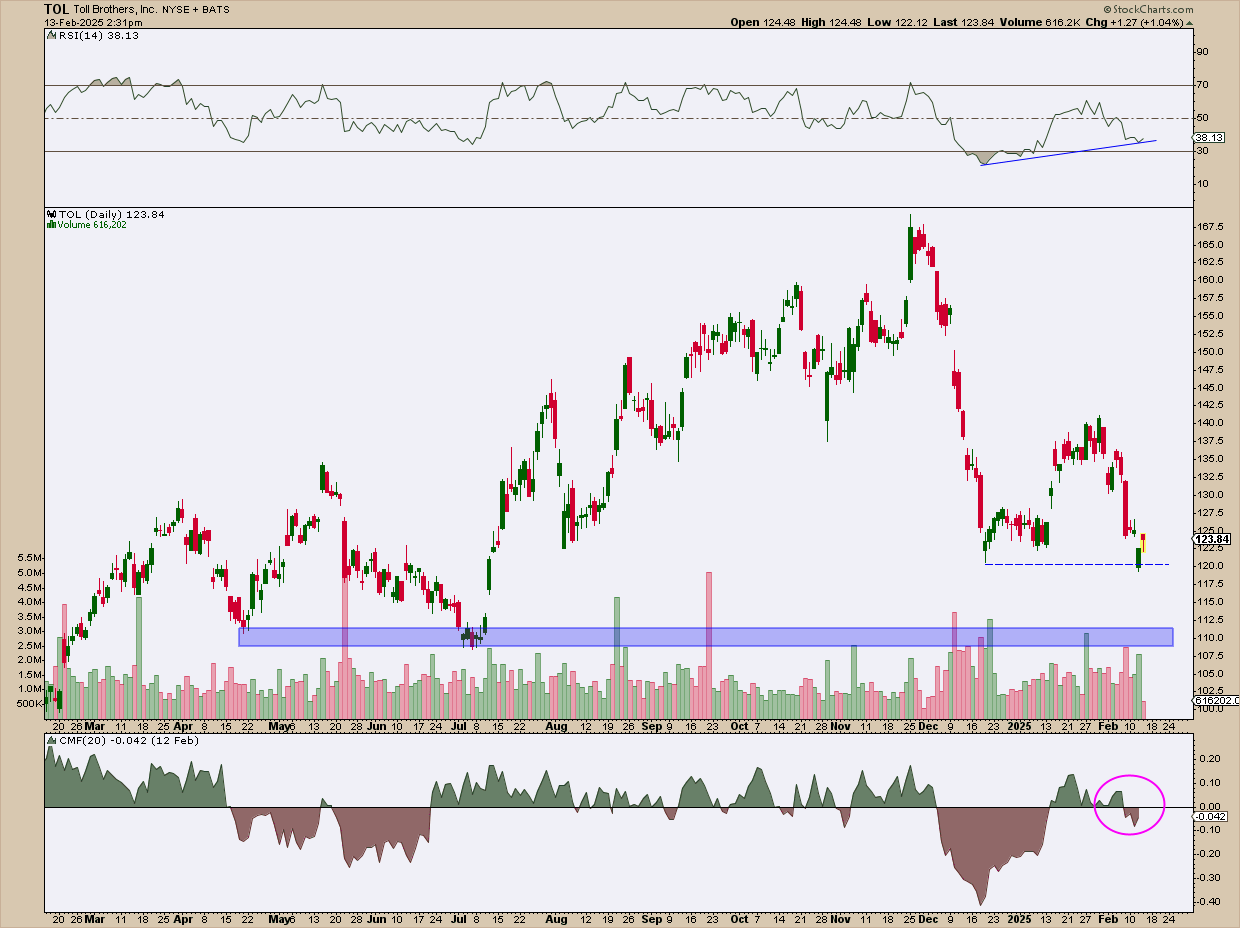
FIGURE 7. DAILY CHART OF TOL. Watch how price responds to these two support levels.
TOL is nearing support at the $120 December swing low. A closer look at the RSI reveals a slight bullish divergence, with the indicator rising from the 30-line even as TOL briefly dips below $120 before staging a strong bounce. Meanwhile, the Chaikin Money Flow (CMF) has fallen into negative territory. However, this dip is less pronounced than in December, when TOL’s price may have formed a bottom.
If TOL closes below $120, the more critical support level is $110. This is the longer-term support level shown in the weekly chart. If TOL remains above this threshold and proceeds to advance, then it’s likely that a bottom may be in place. Check volume and momentum to confirm the reversal if or when it happens.
Next, take a look at this daily chart of DHI.
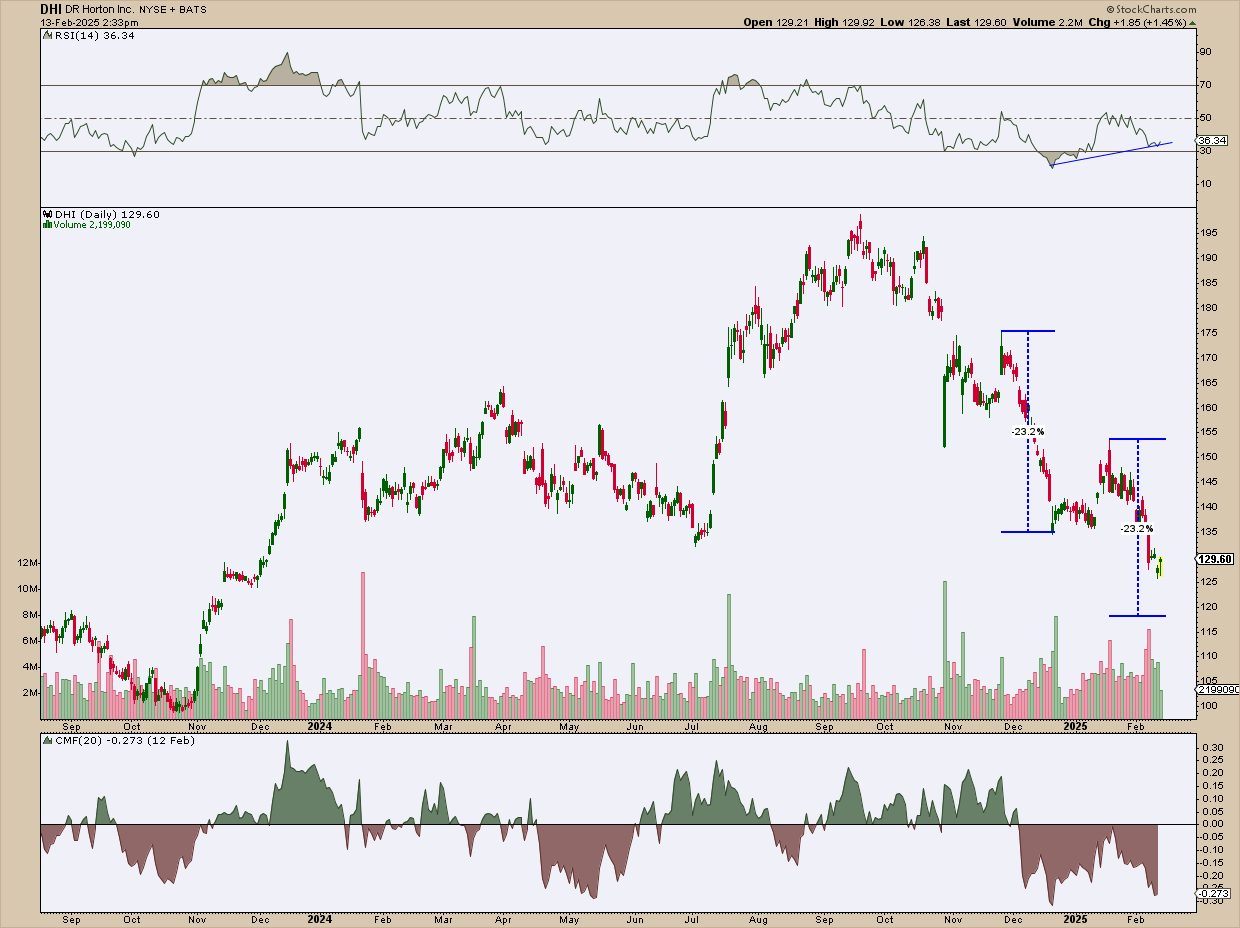
FIGURE 8. DAILY CHART OF DHI. I’m using a measured move approach to determine where it might find support before the next swing low.
If you reference the weekly charts in Figure 6, you’ll see that DHI had fallen below critical support at $135 and is still falling. The next major level of support would be the October 2023 low at $100. However, given the near-symmetry of each swing, you might expect DHI to bounce at the “measured move” level near the $118 range.
The CMF is well below the zero line, indicating that selling pressure is driving the stock’s decline. However, the RSI presents a bullish divergence, with its recent lows trending higher even as the stock continues to fall. Still, without a definitive bounce and a shift in the CMF — a key volume indicator — there’s no clear confirmation that a bottom is in place.
Lastly, let’s switch over to a daily chart of LEN.
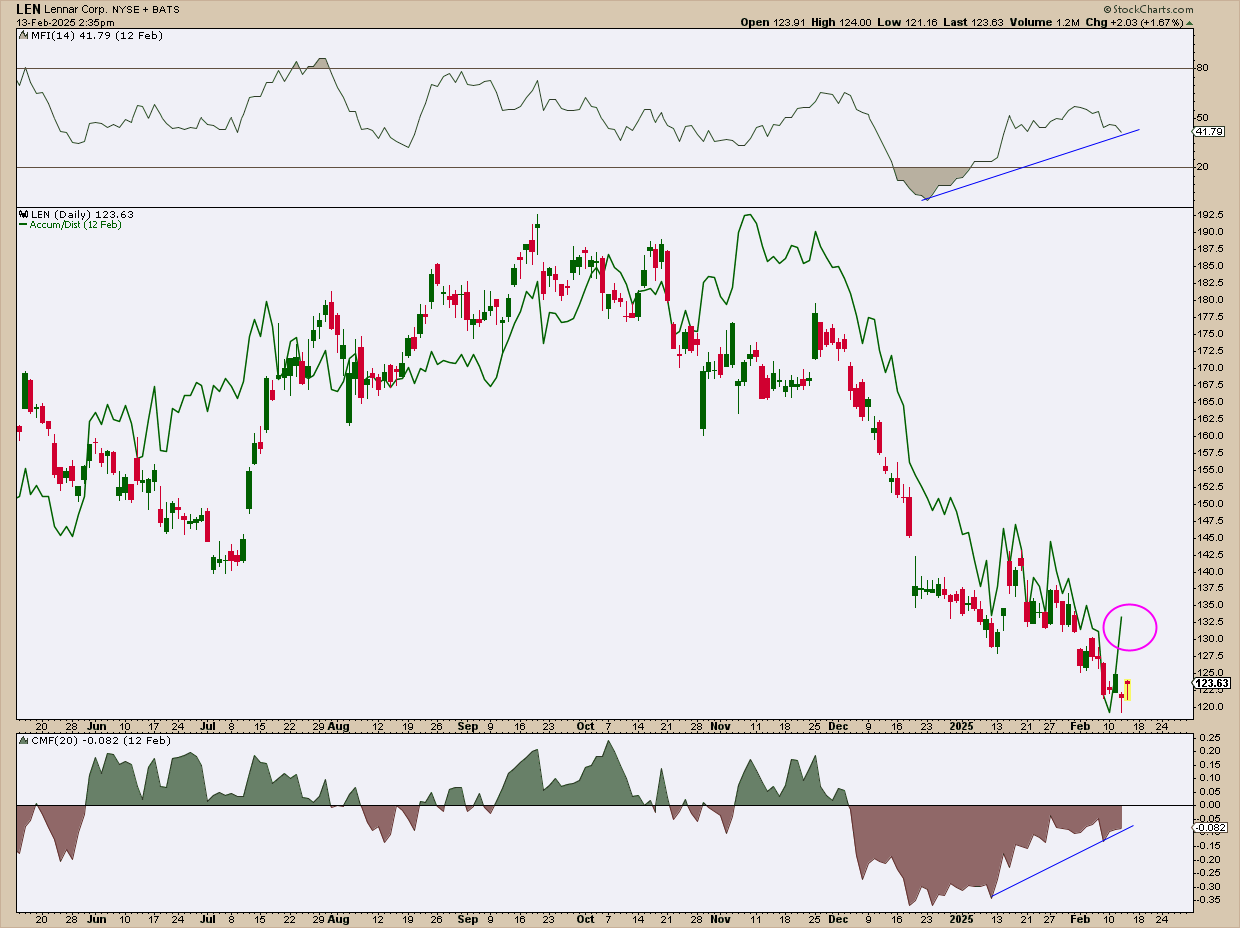
FIGURE 9. DAILY CHAFT OF LEN. In the near term, there’s no support in sight.
The next support level for LEN may be the November 2023 low of $101. In the near term, however, there doesn’t seem to be much in sight to prevent LEN’s descent. That said, a few volume-based signals suggest the selling pressure may not be entirely one-sided.
- The Accumulation/Distribution Line (ADL), shown rising above the current price (see green line), indicates that money flows are increasing; a bullish sign for LEN.
- The volume of selling pressure, according to the CMF, is significantly easing.
- The Money Flow Index (MFI), which tracks volume and momentum, is climbing even as LEN continues to decline, indicating a bullish divergence.
While there’s no sign of bottoming, you may want to continue monitoring the stock for signs of stabilization.
At the Close
This piece demonstrates an attempt to spot bottoming opportunities during Wednesday’s market selloff. By tracking sector performance with StockCharts tools—namely, Advancers & Decliners and Sector Summary—I spotted Real Estate as one of the hardest-hit areas. A New 52-Week Lows scan flagged LEN and DHI, which I compared to TOL using PerfCharts to gauge relative strength. While these stocks haven’t confirmed a bottom yet, there are hints of a shift.
It’s worth adding LEN, DHI, and TOL to your ChartLists and keeping an eye on them. Once they stabilize and bottom out, it could signal an early entry point well before the next uptrend takes shape.

Disclaimer: This blog is for educational purposes only and should not be construed as financial advice. The ideas and strategies should never be used without first assessing your own personal and financial situation, or without consulting a financial professional.