


It was another mildly bullish week as our major indices climbed very close to new, fresh all-time highs. We also saw a return to growth stocks as we approached breakout levels, which is a good signal as far as rally sustainability goes. Despite this, there remain reasons to be cautious and I’ll point out a couple of those reasons below.
Negative Divergences
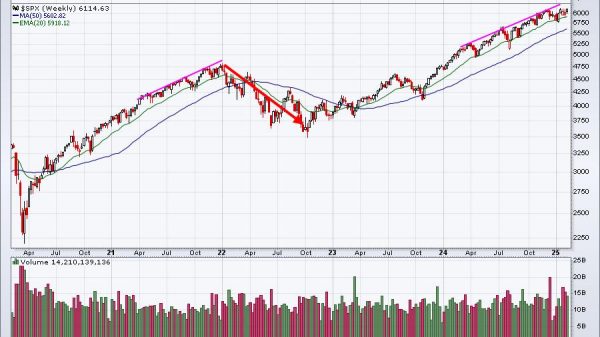
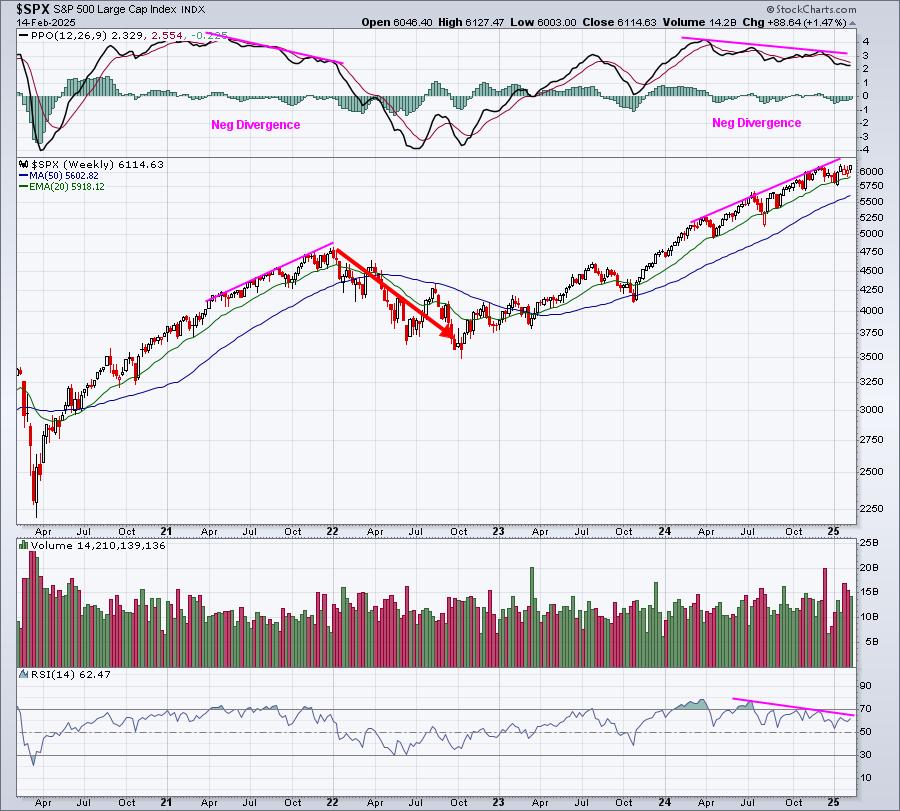
The S&P 500 ($SPX) and NASDAQ 100 ($NDX) both seem to be losing bullish price momentum on their respective weekly charts, which can be seen below:
$SPX
$NDX
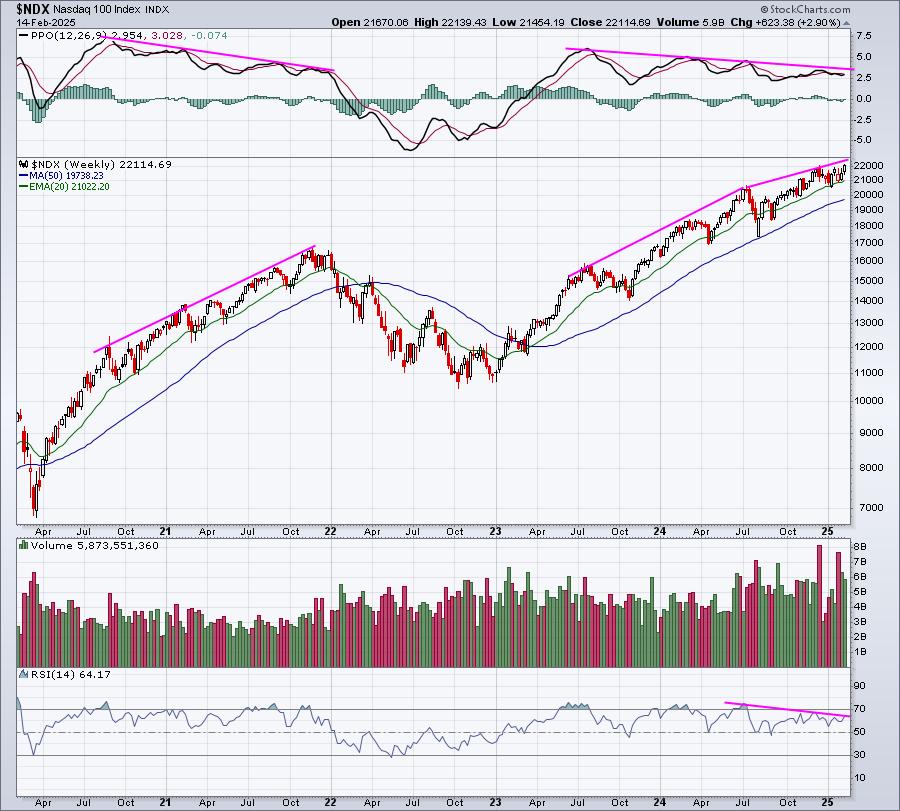
The price momentum on both indices is slowing and eerily similar to late 2021, just before the cyclical bear market of 2022. Let me be clear that I do NOT believe we’re heading into a cyclical bear market. I don’t see that extent of potential weakness ahead. I do see increased risks of a 5-10% drop, however, and that’s why I’m cautious.
Is This Current Rally Truly Sustainable?
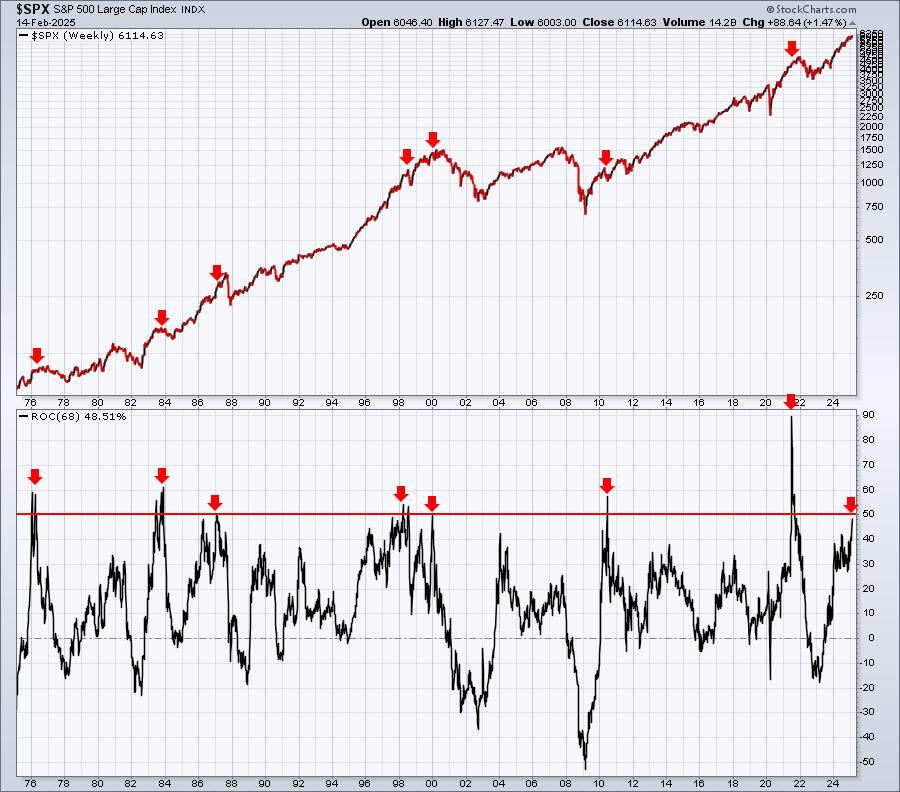
Sometimes a little common sense and perspective goes a very long way. Over the last 75 years, the S&P 500 has averaged gaining 9% per year. So when you go through short-term periods that show gains well in excess of that 9% average, you should at least be thinking there’s the risk that the S&P 500 will fall back and “reversion to the mean”, which is a mathematical concept that describes the tendency of extreme results to move closer to the average. We’ve seen a tremendous rally since the summer correction of 2023. Let’s look at the last 68 weeks (since the correction low in late-October 2023) of return on both the S&P 500 and NASDAQ 100 and compare it to the history of 68-week rates of change (ROC) to gain a sense of this current rally and its sustainability:
$SPX
$NDX
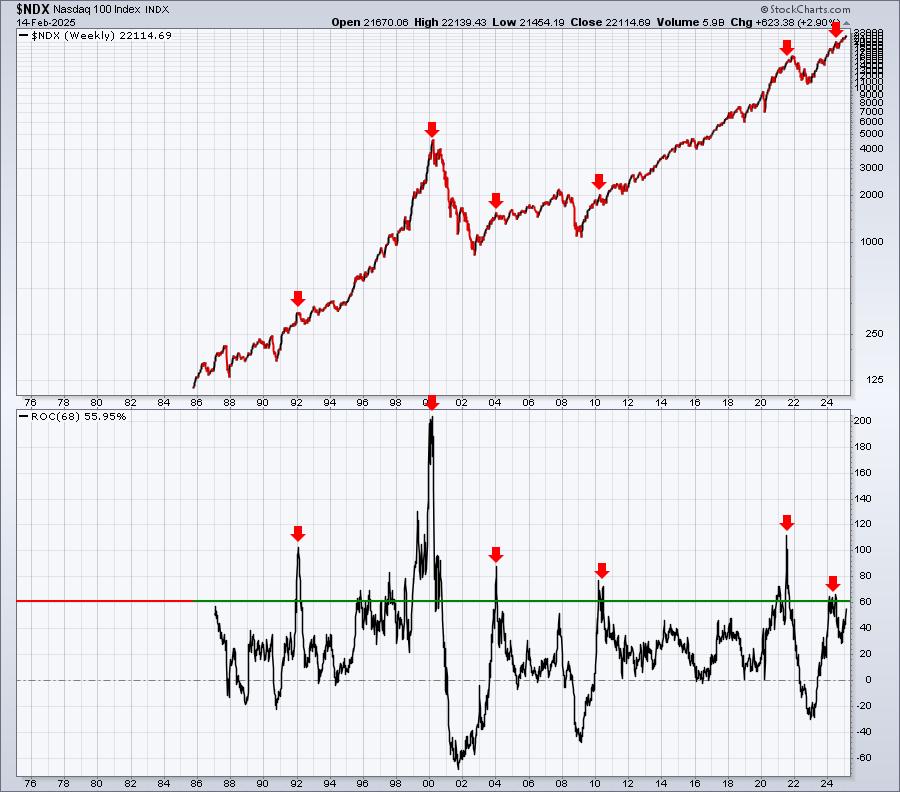
You can look at these two charts and make your own judgement and draw your own conclusions, but, outside of the late-1990s, 68-week ROCs above 50% on the S&P 500 and 60% on the NASDAQ 100 suggest a short-term pullback is more likely, not guaranteed.
Now The Good News
While bullish price action and momentum may seem to be slowing, the long-term monthly PPO on both of these indices is definitely on the rise, which, in my view, limits any short-term downside to the 20-month EMA. I’ll just show the S&P 500 monthly chart, but this will highlight the likelihood that any future selling, if it occurs (no guarantee), holds 20-month EMA support:
$SPX
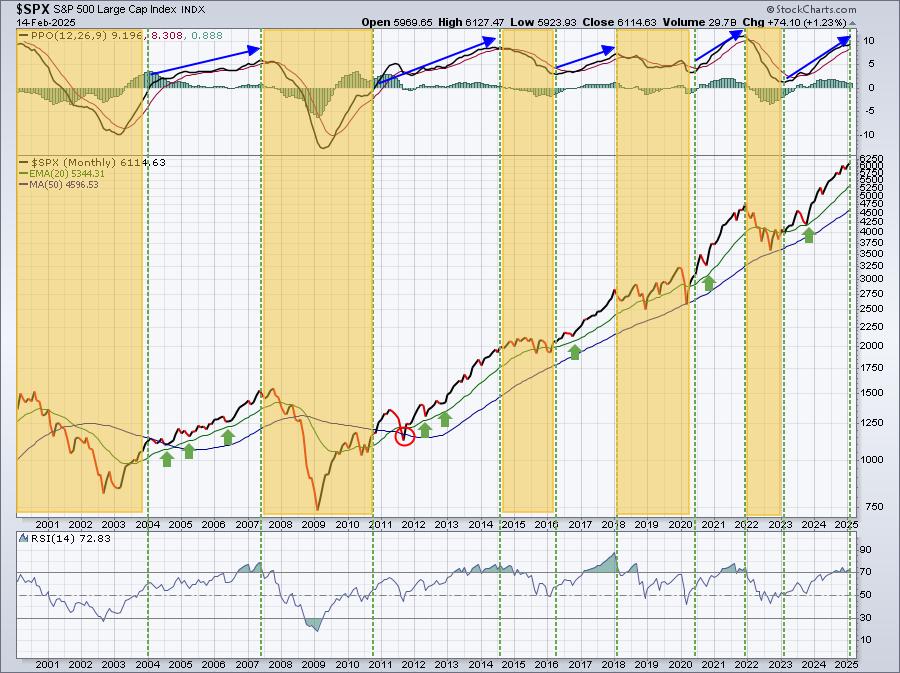
This chart takes us back 25 years to the turn of the century. The yellow areas highlight poor (below zero) or declining PPOs. During these periods, I’d ignore 20-month EMA support and be cautious. However, the blank periods highlight a rising monthly PPO, during which we rarely see price fall below the rising 20-month EMA. This is where we currently stand. Most pullbacks over the last 25 years, when the monthly PPO is above zero and rising, have fallen short of actual 20-month EMA tests. In other words, we should view a 20-month EMA test as a “worst case” scenario.
The next market decline should be viewed as an OUTSTANDING opportunity to enter this secular bull market.
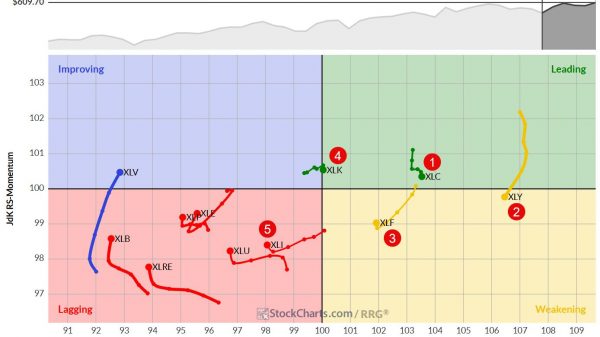
Stick With Strength
Since we began rolling out our Portfolios quarterly, we’ve had to overcome cyclical bear markets in Q4 2018 (trade war), March 2020 (pandemic), and the first 9-10 months of 2022 (rising inflation and rising interest rates), and a 3-month correction during the summer of 2023. We’re remained fully invested and have CRUSHED the S&P 500. In fact, below is a graph that highlights our Model Portfolio performance since its inception in November 2018 (in the middle of the trade war!) through the end of January 2025:
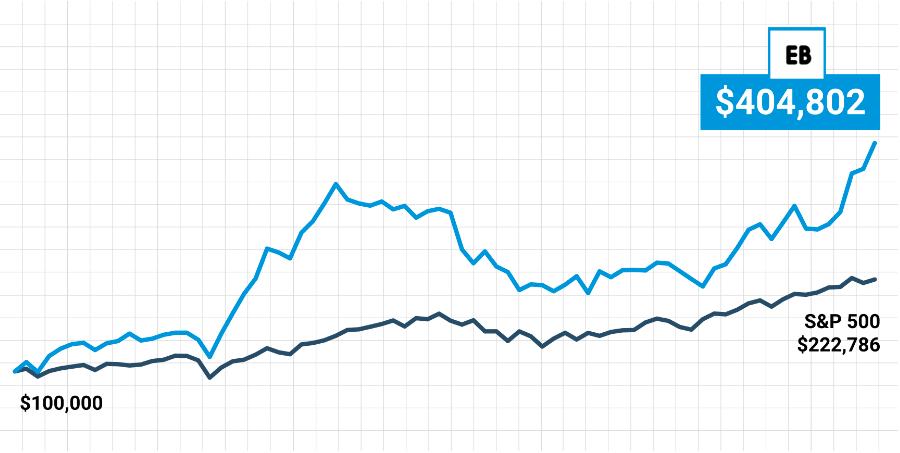
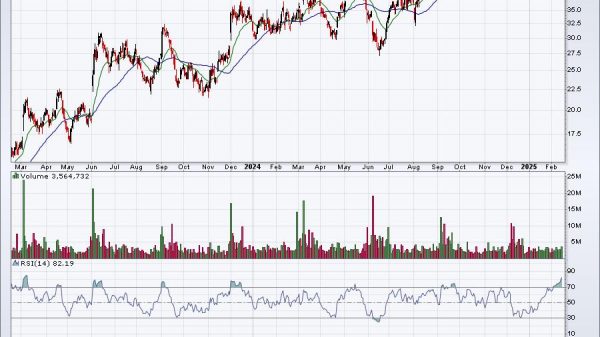
We’ve demonstrated the best way to beat the S&P 500, which is to invest in leading relative strength stocks. It’s the only proven method that’s worked for us at EarningsBeats.com. We “draft” our 10 favorite relative strength stocks in various sectors and industry groups and hold them for one entire earnings cycle, then rinse and repeat. Our last quarter’s “draft” picks have annihilated the S&P 500, +15.15% vs. 3.34%.
You can check out our Model Portfolio holdings for the last 3 months below:
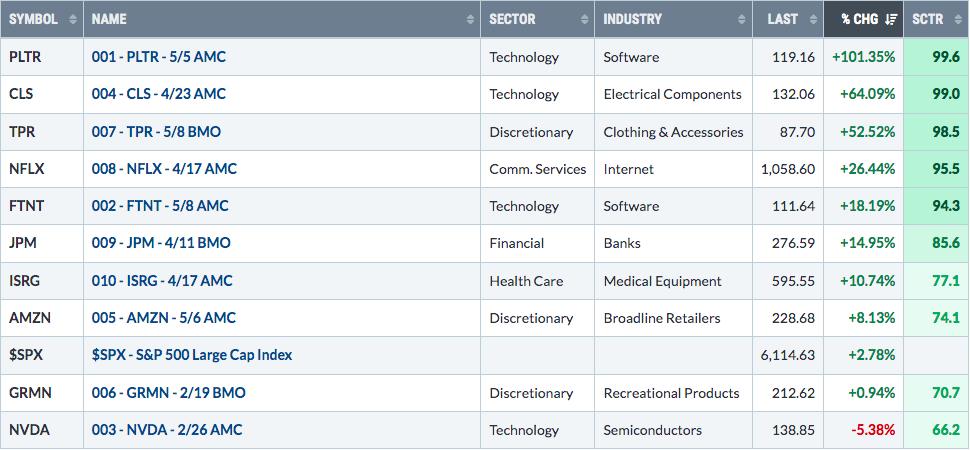
8 of our 10 Model Portfolio stocks outperformed the S&P 500, a few by a very wide margin. Owning relative strength stocks like PLTR, CLS, and TPR will completely carry a portfolio and lead to outstanding returns.
Our “quarterly” results are calculated over the following periods:
- February 19 – May 19
- May 19 – August 19
- August 19 – November 19
- November 19 – February 19
The reason we calculate our quarterly returns using the above time periods is that we select our stocks each quarter on February 19, May 19, August 19, and November 19. By the time we reach these dates, most key market-moving companies have reported their quarterly results and fundamental data like earnings is factored into our portfolio selections just as much as technical considerations. That fundamental/technical combination is one factor that separates us from others and we do this because my background is public accounting. I don’t stray far from my core beliefs. I believe management’s execution of their business strategies/plan and beating revenue and EPS estimates is a huge component of its stock’s upside potential.
On Monday, February 17th, we’re holding our next DRAFT. We will be announcing the 10-equal weighted stocks in each of our portfolios designed to beat the S&P 500 over the next 3-month period. You’re quite welcome to join us. It might change your way of investing and improve your results immediately. CLICK HERE for more information and to register!
Happy trading!
Tom