Connect with us

Hi, what are you looking for?

Stock

Master the Market: A Guide to StockCharts’ New Market Summary Page

Stock market analysis, technical indicators, and market trends are crucial for informed investing. StockCharts is making those things easier, and Grayson Roze is here to show you how.

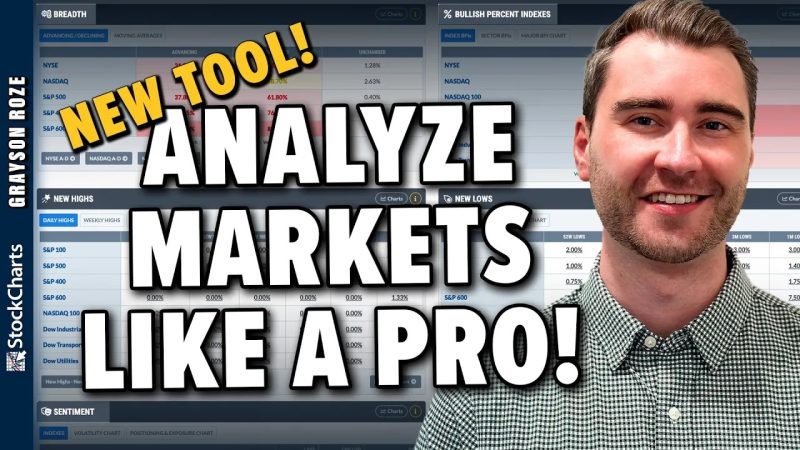
In this video, Grayson provides an in-depth walk-through of the all-new Market Summary Page. This comprehensive tool offers a top-down overview of global and U.S. financial markets, featuring real-time data and professionally curated charts. Learn how to navigate the markets with ease using this centralized resource, designed to enhance your trading strategies and investment decisions. Whether you’re a seasoned trader or just starting out, understanding market dynamics is key. Grayson’s insights will help you leverage the Market Summary Page to stay ahead in the ever-evolving financial landscape.

This video originally premiered on April 11, 2024. Click on the above image to watch on our dedicated Grayson Roze page on StockCharts TV.

You can view previously recorded videos from Grayson at this link.

Enter Your Information Below To Receive Free Trading Ideas, Latest News And Articles.

    Your information is secure and your privacy is protected. By opting in you agree to receive emails from us. Remember that you can opt-out any time, we hate spam too!

    You May Also Like

    Uncategorized

    In Risky Business: Why Insurance Markets Fail and What to Do About It (Yale University Press, 2023), economists Liran Einav (Stanford), Amy Finkelstein (MIT),...

    Uncategorized

    On April 23, 1985, the Coca-Cola Company made one of the biggest mistakes in American business history: it changed the formula for Coca-Cola. Outraged...

    Uncategorized

    Freedom is a complicated idea. Since we can talk about liberty in the positive and the negative, it’s also a contradictory idea. In our...

    Stock

    In this exclusive StockCharts video, Joe breaks down a new SPX correction signal using the monthly Directional Lines (DI), showing why this pullback could...